Table of Contents
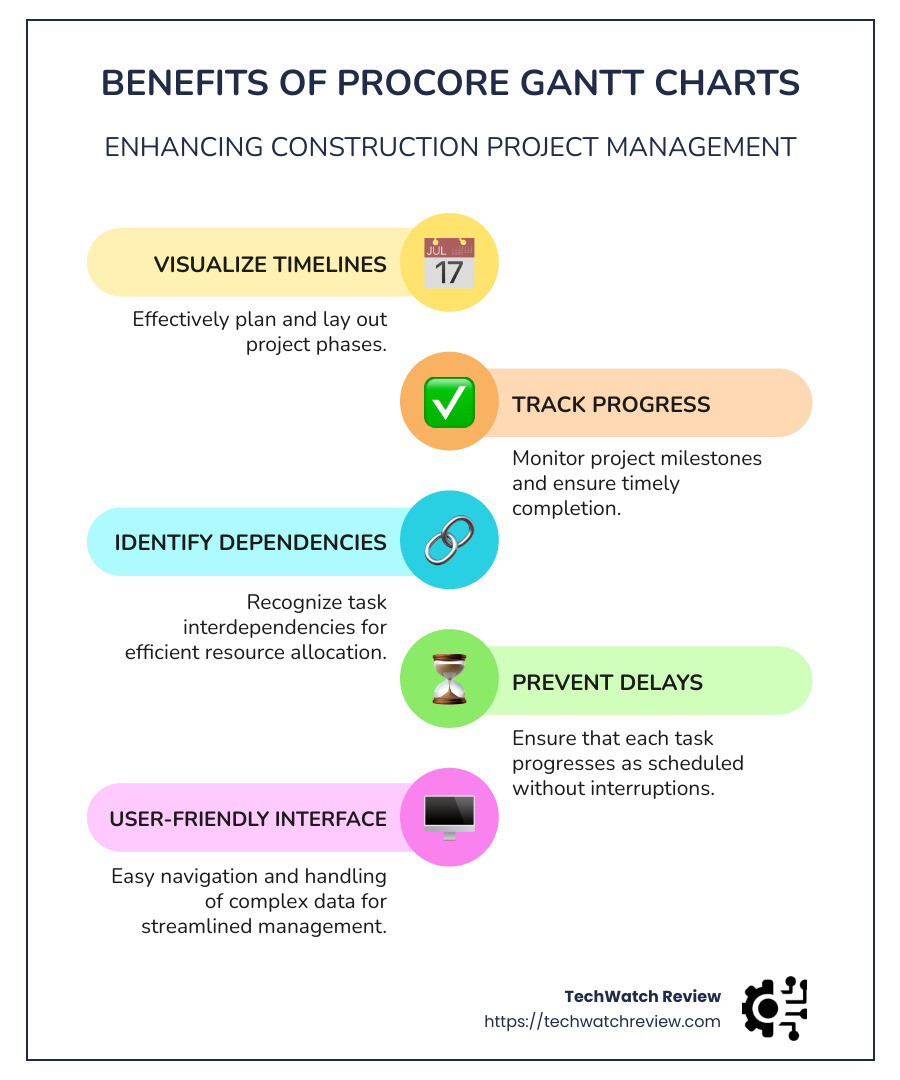
Procore Gantt Chart is an essential tool for visualizing and managing construction project timelines. It allows project managers to efficiently oversee tasks and track progress, ensuring that projects stay on schedule. By displaying tasks across a timeline, this tool provides a clear view of project phases, facilitating the management of complex schedules and coordination between different teams.
- Visualize project timelines for effective planning.
- Track progress and ensure timely milestone completion.
- Identify task dependencies for better resource management.
In the realm of construction projects, managing timelines is critical, and this is where Procore Gantt Chart excels. Mastering this tool can significantly enhance project management, leading to successful project outcomes.
Construction managers rely on Procore Gantt Chart to visualize and manage project tasks. It not only outlines what needs to be done and when but also helps identify task dependencies. This visibility helps prevent delays and ensures that every aspect of the project progresses as planned.
The Procore Gantt Chart‘s user-friendly interface, combined with its capability to handle complex data, makes it a preferred choice among construction professionals. This tool has become an indispensable part of project management in the construction industry.

For more insights, explore these resources:
- Best Construction Gantt Chart Software
- Procore Drawing Management
- Construction Project Management Platform
What is a Gantt Chart?
A Gantt chart is a visual guide that helps project managers organize and track project tasks over time. It’s like a roadmap for your project, showing when each task starts and ends.
Visual Guide
The Gantt chart uses a timeline, usually displayed horizontally, to represent the duration of the project. Each task is shown as a bar stretching from its start date to its end date. This makes it easy to see at a glance which tasks are in progress and which are upcoming.
Project Tasks
In a Gantt chart, each task is represented by a bar. The length of the bar shows the task’s duration. Tasks can be anything from planning and design to construction and inspection in a construction project.
Time Axis
The horizontal axis of the Gantt chart represents time. This can be broken down into days, weeks, or months depending on the project’s scope. This time axis helps project managers see when tasks are scheduled to start and finish.
Task Overlap
Gantt charts are great at showing task overlap. You can see which tasks can happen simultaneously and which need to wait for others to finish. This overlap is crucial for efficient project management, allowing teams to work on multiple tasks at once without waiting unnecessarily.
Dependencies
One of the most powerful features of Gantt charts is their ability to show dependencies. Dependencies are relationships between tasks that dictate the order in which they must be completed. For example, you can’t start building a wall until the foundation is laid. Gantt charts use lines or arrows to connect dependent tasks, making these relationships clear and easy to manage.
Using a Gantt chart in construction projects helps keep everything organized and on track. By visualizing tasks, timelines, and dependencies, project managers can ensure that all parts of the project are aligned and moving forward smoothly.
Incorporating Gantt charts into your project management workflow can significantly improve your ability to manage complex schedules and ensure successful project completion.
The History of Gantt Charts
The Gantt chart has a fascinating history that dates back to the early 1900s. It all began with Henry Gantt, an American mechanical engineer and management consultant, who developed this innovative tool to improve project management.
Henry Gantt and the Early 1900s
In the early 20th century, Henry Gantt sought to create a method for visualizing project schedules that would be easy to understand and use. His invention, the Gantt chart, was revolutionary because it allowed managers to see the progress of a project at a glance. Each task was represented as a bar on a timeline, providing a clear visual representation of when tasks should start and end.
Gantt’s charts were initially created manually. Project managers would draw them by hand, using rulers and pencils to map out tasks and timelines. This process was time-consuming but invaluable for managing complex projects, particularly during World War I, where Gantt charts were used to optimize shipbuilding schedules.
Manual Creation
Before the advent of computers, creating a Gantt chart required meticulous attention to detail. Each update meant erasing and redrawing parts of the chart, which could be cumbersome, especially for large projects with many tasks and dependencies. Despite these challenges, Gantt charts became an essential tool for project management, praised for their ability to simplify complex schedules.
Software Evolution
With the rise of computers in the late 20th century, the creation and management of Gantt charts underwent a significant change. Software programs like Microsoft Project and Primavera 6 emerged, allowing project managers to build and update Gantt charts digitally. These programs automated much of the manual work, making it easier to adjust timelines, add tasks, and manage dependencies.
Today, platforms like Procore have further advanced the functionality of Gantt charts. Integrated with construction management systems, Procore’s Gantt charts offer features like real-time updates, collaboration tools, and detailed analytics. This evolution has made Gantt charts more accessible and powerful, enabling project managers to keep projects on schedule and within budget.
In summary, the evolution of the Gantt chart from manual drawings to sophisticated software tools illustrates its enduring value in project management. By visually organizing tasks and timelines, Gantt charts have become indispensable for ensuring successful project execution in various industries, especially construction.
Benefits of Using Gantt Charts in Construction Projects
Gantt charts are an invaluable tool in construction projects, offering numerous benefits that streamline project management and improve collaboration.
Enhancing Collaboration
Construction projects often involve multiple teams and stakeholders. A Gantt chart serves as a central hub where everyone can access the latest project updates. This visibility fosters collaboration by ensuring all team members are on the same page. Instead of wading through emails or lengthy reports, stakeholders can quickly see task statuses and upcoming deadlines. This transparency helps prevent miscommunication and ensures that everyone is working towards the same goals.
Tracking Project Progress
One of the standout features of Gantt charts is their ability to provide a clear snapshot of project progress. By visually representing tasks and their completion status, project managers can quickly assess whether the project is on track. This feature is particularly useful for identifying bottlenecks or delays early on, allowing for timely interventions. For instance, using a Gantt view, managers can enable the “percent complete” feature to see how much of each task has been finished, aiding in accurate progress tracking.
Managing Dependencies
Construction projects are complex, with many tasks dependent on the completion of others. Gantt charts excel at highlighting these dependencies, making it easier to manage them effectively. By understanding which tasks must be completed before others can begin, project managers can allocate resources more efficiently and avoid scheduling conflicts. This proactive management of dependencies helps keep the project moving smoothly without unnecessary interruptions.
Effective Timeline Management
Gantt charts are essential for setting and managing project timelines. They provide a visual representation of the entire project schedule, making it easier to plan and adjust timelines as needed. This overview helps managers allocate resources appropriately and ensure that all tasks are completed within the set deadlines. Effective timeline management is crucial in construction, where delays can lead to increased costs and logistical challenges.
Preventing Scope Creep
Scope creep, or the gradual expansion of a project’s scope without corresponding adjustments to time, cost, or resources, is a common challenge in construction projects. Gantt charts help prevent scope creep by providing a clear visual outline of the project’s tasks and timelines. With a Gantt chart, project managers can easily see when new tasks are being added and assess their impact on the overall schedule. This visibility allows for better control over the project scope and helps keep the project on track and within budget.
In conclusion, the use of Gantt charts in construction projects offers significant benefits in terms of collaboration, progress tracking, dependency management, timeline management, and scope control. These advantages make Gantt charts an indispensable tool for successful project management.
How to Create a Gantt Chart Using Procore
Creating a Gantt chart in Procore is a straightforward process that can greatly enhance your project management capabilities. With Procore’s Scheduling Tool, you can effectively plan, track, and manage your construction projects with ease. Here’s a step-by-step guide on how to create a Gantt chart using Procore.
Step 1: Input Tasks
Begin by accessing the Procore Scheduling Tool. This tool allows you to input each task associated with your project. For each task, you’ll need to provide essential details such as the task name, start and end dates, and any dependencies it may have. This information forms the backbone of your Gantt chart, ensuring that all tasks are accounted for and properly sequenced.
Step 2: Access the Gantt View
Once you’ve input all tasks, switch to the Gantt view to see a bar chart representation of your project. This view provides a visual overview of your project timeline, with horizontal bars representing each task. The length of each bar corresponds to the duration of the task, allowing you to easily see how tasks overlap and identify any potential scheduling conflicts.
Step 3: Use Filters
Procore’s Gantt view offers various filters to customize the information displayed on your chart. You can filter tasks based on criteria such as task status, assigned team members, or specific date ranges. This feature helps you focus on the most relevant information and streamline your project management process. For instance, filtering by “critical paths” can help you identify tasks that are crucial to meeting project deadlines.
Step 4: Enable Percent Complete
To track progress effectively, enable the percent complete feature in the Gantt view. This feature uses a color gradient to show how much of each task has been completed. By visualizing task progress, project managers can quickly assess whether the project is on track and make informed decisions about resource allocation and scheduling adjustments.
By following these steps, you can create a comprehensive Gantt chart in Procore that improves your project management efforts. The Gantt view not only provides a clear visual representation of your project timeline but also offers powerful tools for tracking progress and managing tasks effectively.
For more detailed guidance on using Procore’s Gantt charts, you can refer to Procore’s official documentation or explore additional resources on scheduling and project management on TechWatch Review.
Viewing Options in Procore Gantt Charts
Once you’ve created a Gantt chart in Procore, you can take advantage of various viewing options to tailor the chart to your needs. These options help you focus on specific aspects of your project, making it easier to manage complex schedules. Here’s how you can use these features effectively:
Zoom Levels
Procore allows you to adjust the zoom levels of your Gantt chart. This feature lets you zoom in for a detailed view of tasks over shorter time frames or zoom out for an overview of the entire project timeline. Adjusting the zoom level is particularly useful for project managers who need to switch between a broad project overview and a detailed analysis of specific tasks. For more tips on managing project timelines, check out our project management guide.
Filters
The filter options in Procore’s Gantt charts enable you to display only the information you need. For example, you can filter tasks by status, date range, or team member responsibilities. This is especially helpful when you want to focus on tasks within a specific phase or identify tasks that are part of the critical path. Filtering by critical paths highlights tasks that directly impact the project’s completion date, allowing you to prioritize them effectively. Learn more about effective task management in our task management article.
Configurable Columns
With configurable columns, you can choose which data fields are visible on your Gantt chart. You can sort these columns numerically or alphabetically, depending on the field type. This flexibility allows you to customize the chart to display information that is most relevant to your project, such as task priority, assigned resources, or deadlines. For insights on customizing project tools, visit our customization tips.
Critical Paths
Identifying the critical path is crucial for project management. The critical path consists of tasks that must be completed on time for the entire project to stay on schedule. In Procore, you can highlight these tasks to ensure they receive the attention they need. By focusing on the critical path, project managers can better allocate resources and mitigate potential delays. For strategies on resource allocation, see our resource management strategies.
Dependencies
Understanding dependencies between tasks is vital for successful project scheduling. In Procore, you can easily view and manage task dependencies, which are represented by arrows connecting related tasks. This allows you to see how changes in one task can impact others, helping you plan more effectively and avoid scheduling conflicts. For more on managing dependencies, explore our dependency management guide.
By using these viewing options, you can maximize the utility of Procore Gantt charts, ensuring that you have a clear, organized view of your project schedule. These tools help streamline project management, making it easier to track progress and make informed decisions.
For further insights on optimizing your use of Procore Gantt charts, you can explore Procore’s support resources.
Step-by-Step Guide to Viewing a Procore Gantt Chart
Navigating Procore’s Gantt chart is straightforward once you understand the basic steps. Here’s a step-by-step guide to help you get started:
-
Steer to the Schedule Tool: Begin by accessing the Schedule tool within your project dashboard. This is your gateway to viewing and managing your project timelines.
-
Click the Gantt Tab: Once in the Schedule tool, click on the Gantt tab. This will display your project schedule in the Gantt chart format, with horizontal bars representing tasks and their durations.
-
Understanding Horizontal Bars and Schedule Logic: The Gantt chart uses horizontal bars to illustrate the amount of work done relative to the time allocated for each task. The schedule logic, which dictates the sequence of tasks, is visually represented, providing a clear overview of your project’s workflow.
-
Update Schedule File: Regular updates to your schedule file ensure your Gantt chart reflects the most current project status. This step is essential for maintaining accurate timelines and dependencies.
Configuring Columns in Procore Gantt Charts
Customizing your Gantt chart view can be achieved through the configuration of columns:
-
Filter Columns: Decide which columns are visible on your chart by using the filter options. This helps focus on the most relevant data for your project.
-
Sort Columns: Organize your columns either numerically or alphabetically based on the field type. This feature allows for easy data management and retrieval.
Using View Toggles in Procore Gantt Charts
View toggles improve your ability to customize what is displayed on the Gantt chart:
-
Filter Options: Use filters to view specific aspects of your project, such as tasks within a certain date range or tasks assigned to a particular team member. This helps in managing large projects with numerous tasks.
-
Critical Paths: Highlighting the critical path is crucial as it identifies tasks that directly affect the project’s completion date. This allows you to focus on tasks that require immediate attention.
-
Percent Complete and Dependencies: Enable these features to monitor task progress and understand how tasks are interrelated. Dependencies are shown with arrows, making it easy to see which tasks rely on others.
Zoom Levels in Procore Gantt Charts
Adjusting the zoom levels provides flexibility in how you view your project:
-
Zoom In: For a detailed view of tasks over shorter time frames, use the zoom-in function. This is useful for examining specific tasks closely.
-
Zoom Out: For an overall view of the project timeline, zoom out. This broader perspective is ideal for reviewing the entire project schedule.
By following these steps and utilizing the available features, you can effectively manage your project schedule with Procore Gantt charts. This ensures you have a clear understanding of task progress, dependencies, and critical paths, aiding in better project management and decision-making. For more detailed guidance, Procore’s support resources can be a valuable tool.
Frequently Asked Questions about Procore Gantt Charts
Does Procore have a Gantt chart?
Yes, Procore does offer a Gantt chart view as part of its scheduling tool. This feature provides a visual representation of your project schedule, using horizontal bars to illustrate task durations and progress. The Gantt view is an essential tool for understanding the schedule logic of your project, as it helps visualize the sequence and timing of tasks.
To access the Gantt chart in Procore, steer to the project’s Schedule tool and click on the Gantt tab. Here, you’ll see a comprehensive display of your project schedule, including task dependencies and timelines. Regularly updating the project schedule file ensures that the Gantt chart reflects the most current project status, aiding in accurate project management.
Do project managers still use Gantt charts?
Absolutely, project managers continue to rely on Gantt charts as a crucial tool for visual organization. Gantt charts provide a clear overview of task deadlines and project progress, making them invaluable for managing complex projects. They help in planning and tracking tasks, ensuring that project schedules are adhered to and deadlines are met.
The ability to see the entire project timeline at a glance allows project managers to identify potential bottlenecks and allocate resources effectively. Despite the emergence of new project management tools, the Gantt chart remains a staple due to its straightforward and effective visualization of project schedules.
Are Gantt charts obsolete?
Gantt charts are far from obsolete; however, they do face some challenges. Traditional Gantt charts can sometimes hinder communication if not updated regularly, leading to outdated information being shared among team members. This is why modern software improvements, like those in Procore, are vital. They allow for real-time updates and collaboration, mitigating these update challenges.
Moreover, while Gantt charts are excellent for visualizing task sequences, they might not capture the full complexity of a project. This is where additional features, such as dependencies and critical paths, come into play, providing a more nuanced view of the project.
In conclusion, while Gantt charts have their limitations, modern tools have improved their functionality, ensuring they remain a powerful tool in the project management arsenal. For more insights on the evolution of project management tools, explore TechWatch Review’s blog.
At TechWatch Review, we understand the complexities of construction management and the importance of effective project scheduling. Procore Gantt charts stand out as a vital tool in this domain, offering project managers a clear visual representation of project timelines and task dependencies.
Gantt charts have evolved significantly since their inception in the early 1900s. Today, they are integrated into sophisticated software like Procore, which improves their utility by allowing real-time updates, collaboration, and advanced features like critical path analysis. This evolution ensures that Gantt charts remain relevant and invaluable for managing construction projects.
By utilizing Procore’s Gantt charts, project managers can make informed decisions that help prevent scope creep and ensure timely project completion. The ability to visualize the entire project timeline aids in resource allocation and identifying potential bottlenecks, making it easier to keep projects on track.
For those in the construction industry, staying updated with the latest project management tools is crucial. At TechWatch Review, we provide expert insights and reviews to help you steer the ever-changing landscape of construction management technology. Find more about how these tools can improve your project management strategies by visiting our TechWatch Review blog and exploring articles like this one on construction software trends.
When efficient project management can make or break a construction project, Procore Gantt charts offer a reliable solution for maintaining clarity and control over project schedules.